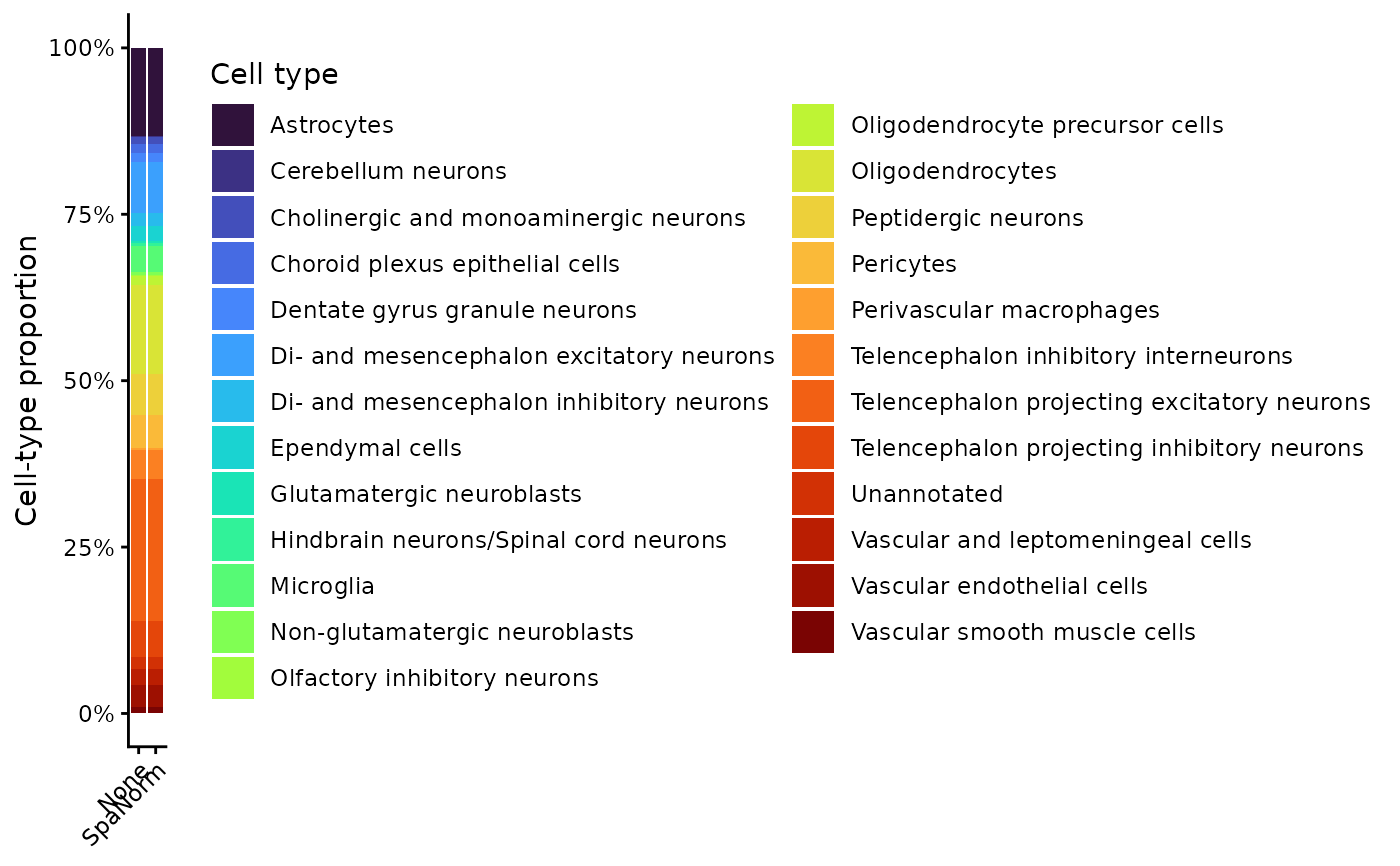
Plot cell-type proportions stored in the colData of annotated SpatialExperiment objects across normalisation methods.
Usage
plot_celltype_proportion(
  norm_list,
  annotation_col = "SingleR_label",
  method_order = NULL,
  palette = NULL,
  show = "proportion",
  theme_name = "classic"
)
Arguments
- norm_list
Named list of annotated SpatialExperiment objects.
- annotation_col
Name of the colData column containing cell-type annotations.
- method_order
Optional character vector specifying the order of normalisation methods.
- palette
Optional named character vector specifying colours for cell types.
- show
Character specifying whether to show `"proportion"` or `"count"`.
- theme_name
Plot theme. One of `"classic"`, `"bw"`, `"minimal"`, or `"gray"`.
Examples
data(norm_example)

p <- plot_celltype_proportion(
  norm_list = norm_example,
  annotation_col = "cell_type",
  method_order = NULL,
  palette = "turbo",
  show = "proportion",
  theme_name = "classic"
)

p$plot