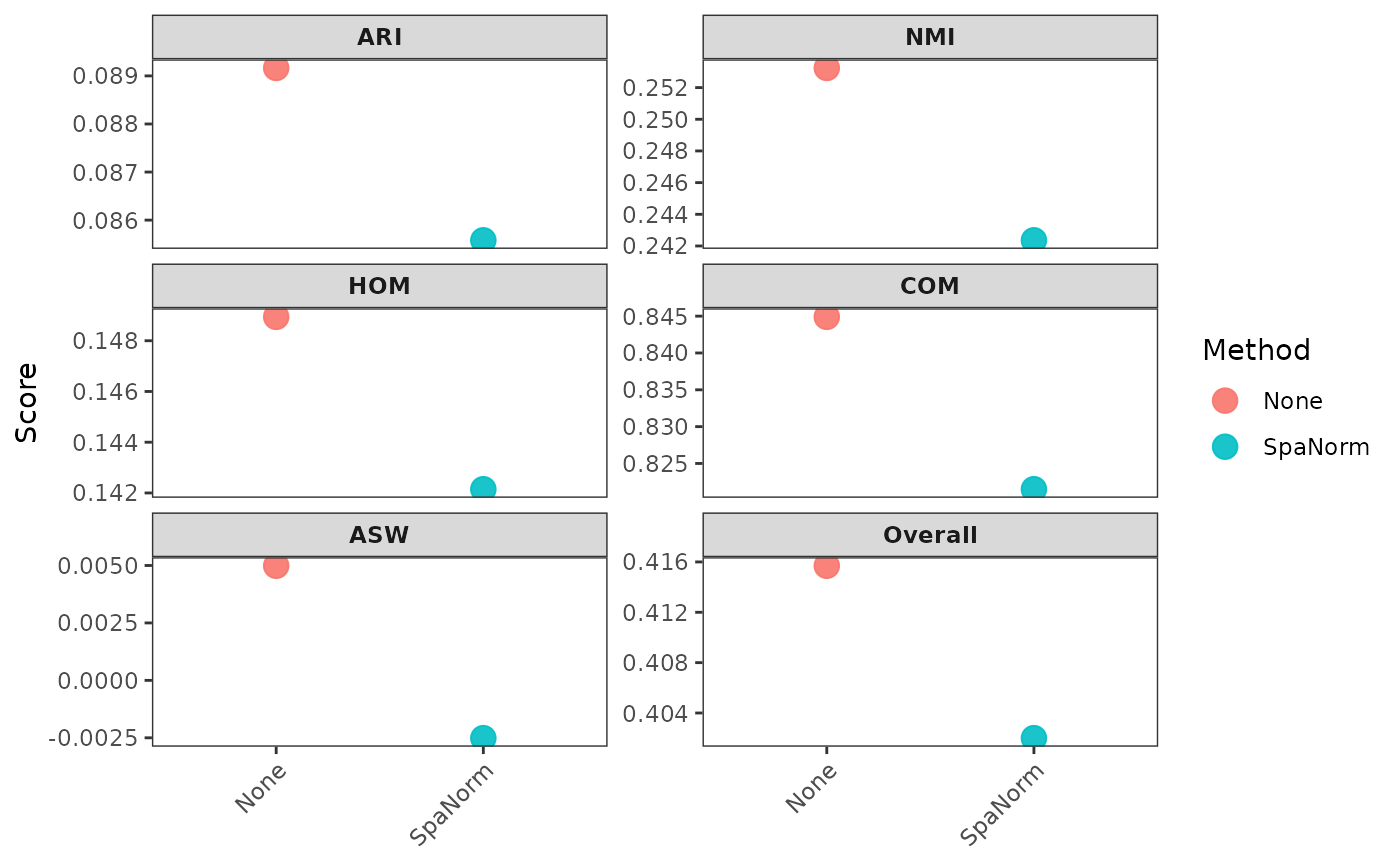
Plot clustering metrics across normalisation methods
Source:R/clustering_runner.R
plot_clustering_metrics.RdEach facet represents one clustering metric. Points are coloured by normalisation method.
Usage
plot_clustering_metrics(
  metrics_df,
  metrics = c("ARI", "NMI", "HOM", "COM", "ASW", "Overall"),
  point_size = 4,
  point_alpha = 0.9,
  ncol = 3,
  scales = "free_y",
  palette = NULL,
  theme_name = "classic",
  rotate_x = 45
)
Arguments
- metrics_df
Data frame from calculate_clustering_metrics().
- metrics
Metrics to plot.
- point_size
Point size.
- point_alpha
Point opacity.
- ncol
Number of facet columns.
- scales
Facet scales.
- palette
Optional named colours for normalisation methods.
- theme_name
One of "classic", "bw", "minimal", "gray".
- rotate_x
Angle of method labels.
Examples
data(norm_example)

banksy_norm <- run_banksy_individual(
  norm_list = norm_example,
  seed = 123
)
#> Computing neighbors...
#> Spatial mode is kNN_median
#> Parameters: k_geom=15
#> Done
#> Done
#> Using seed=123
#> Using seed=123
#> Computing neighbors...
#> Spatial mode is kNN_median
#> Parameters: k_geom=15
#> Done
#> Done
#> Using seed=123
#> Using seed=123

metrics_df <- calculate_clustering_metrics(
  norm_list = banksy_norm,
  ground_truth_col = "layer_guess",
  cluster_col = "banksy_cluster"
)

p <- plot_clustering_metrics(
  metrics_df = metrics_df,
  metrics = c("ARI", "NMI", "HOM", "COM", "ASW", "Overall"),
  point_size = 4,
  ncol = 2,
  scales = "free_y",
  theme_name = "bw"
)

p$plot