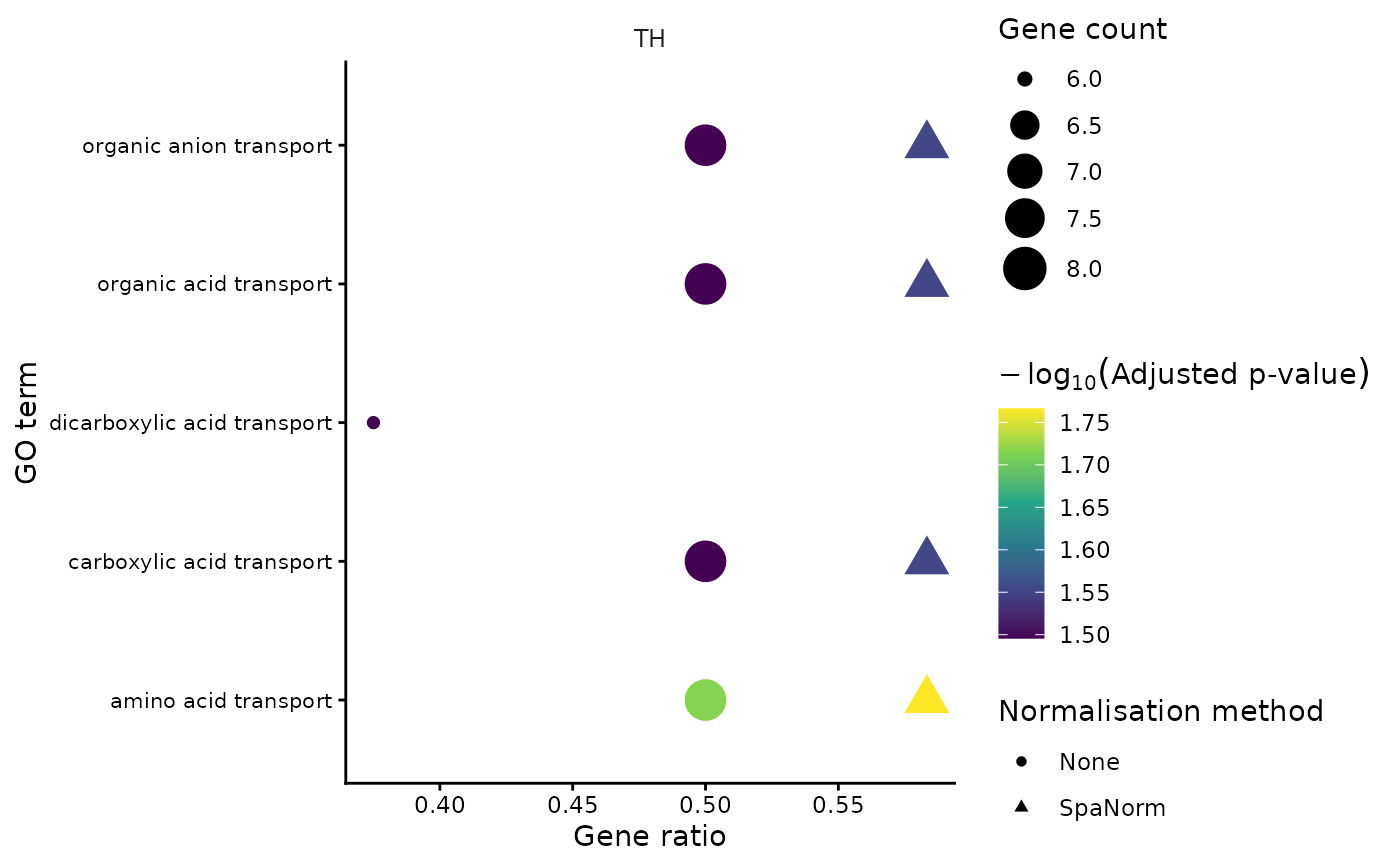
Plot enriched Gene Ontology terms across normalisation methods and spatial clusters.
Usage
plot_go(
  go_result,
  top_n = 5,
  method_col = "method",
  cluster_col = "cluster",
  method_order = NULL,
  point_size_range = c(2, 7),
  theme_name = "classic",
  methods = NULL,
  title = NULL,
  subtitle = NULL,
  ncol = 3
)
Arguments
- go_result
Output from calculate_go() or GO data frame.
- top_n
Number of top GO terms per method and cluster. If NULL, all available GO terms are displayed.
- method_col
Column containing normalisation methods.
- cluster_col
Column containing cluster assignments.
- method_order
Optional normalisation method order.
- point_size_range
Minimum and maximum point sizes.
- theme_name
Plot theme.
- methods
Optional methods to display.
- title
Optional plot title.
- subtitle
Optional plot subtitle.
- ncol
Number of facet columns.
Details
Point size represents gene count, colour represents enrichment significance, and shape represents the normalisation method.
Examples
data(norm_ccc_example)

go_result <- calculate_go(
  norm_list = norm_ccc_example,
  cluster_col = "layer_guess",
  methods = names(norm_ccc_example),
  assay_name = "logcounts",
  OrgDb = org.Mm.eg.db::org.Mm.eg.db,
  key_type = "SYMBOL",
  ont = "BP",
  fdr_cutoff = 0.05,
  min_prop = 0.4,
  min_spots = 10,
  min_genes = 5,
  pvalue_cutoff = 0.05,
  qvalue_cutoff = 0.05,
  p_adjust_method = "BH",
  readable = TRUE,
  test_type = "t"
)

p_go <- plot_go(
  go_result = go_result,
  top_n = 5,
  method_col = "method",
  cluster_col = "cluster",
  point_size_range = c(2, 7),
  theme_name = "classic",
  ncol = 2
)

p_go$plot