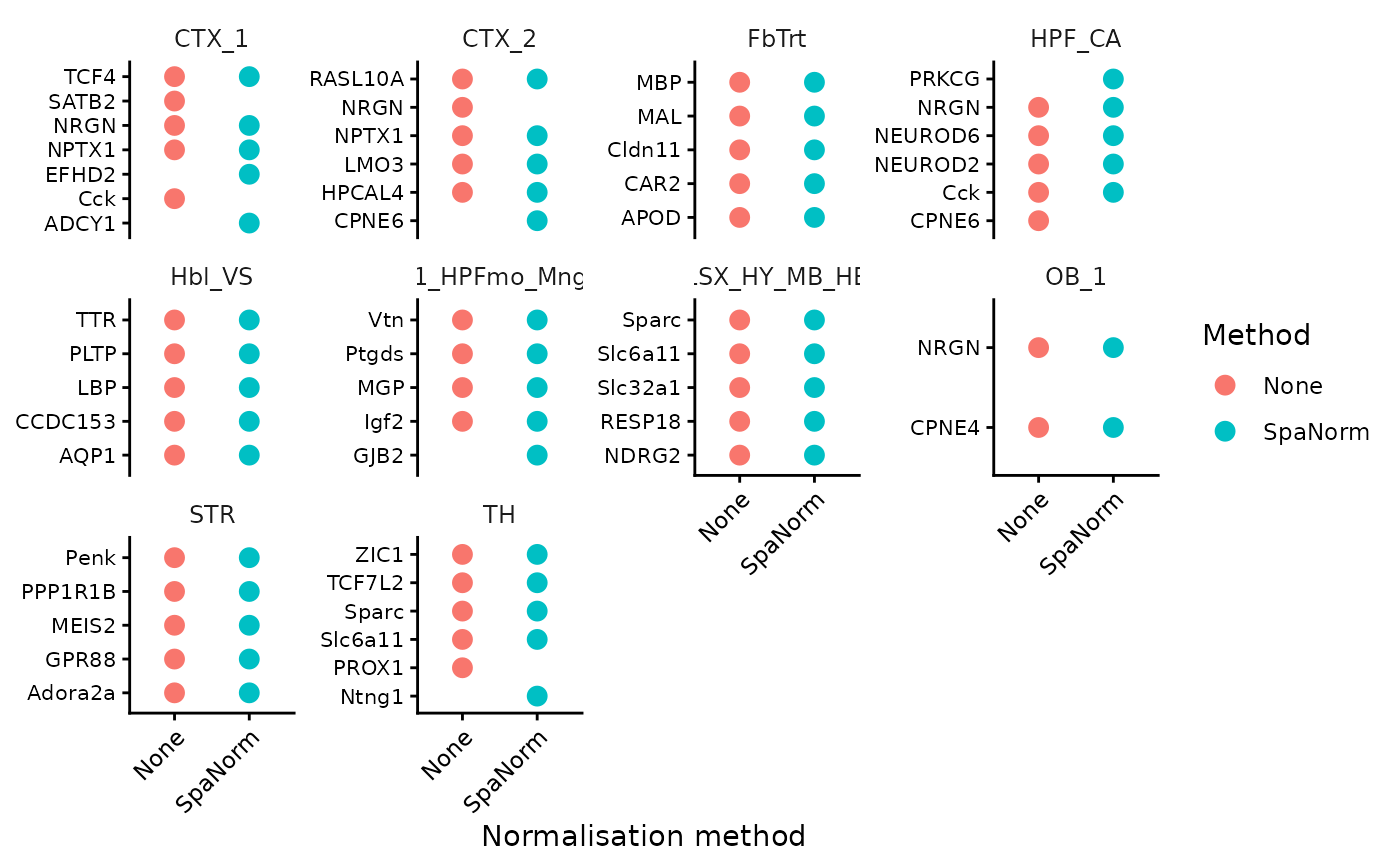
Plot the top cluster-specific DE genes detected under each normalisation method.
Usage
plot_go_genes(
  go_result,
  top_n = 5,
  method_col = "method",
  cluster_col = "cluster",
  gene_col = "gene",
  method_order = NULL,
  point_size = 3,
  palette = NULL,
  theme_name = "classic"
)
Arguments
- go_result
Result returned by `calculate_go()`, or the gene data frame contained in `go_result$genes`.
- top_n
Number of top DE genes shown per normalisation method and cluster.
- method_col
Name of the column containing normalisation methods.
- cluster_col
Name of the column containing clusters.
- gene_col
Name of the column containing gene names.
- method_order
Optional character vector specifying the order of normalisation methods.
- point_size
Point size.
- palette
Optional named character vector specifying colours for normalisation methods.
- theme_name
Plot theme. One of `"classic"`, `"bw"`, `"minimal"`, or `"gray"`.
Examples
data(norm_ccc_example)

go_result <- calculate_go(
  norm_list = norm_ccc_example,
  cluster_col = "layer_guess",
  methods = names(norm_ccc_example),
  assay_name = "logcounts",
  OrgDb = org.Mm.eg.db::org.Mm.eg.db,
  key_type = "SYMBOL",
  ont = "BP",
  fdr_cutoff = 0.05,
  min_prop = 0.4,
  min_spots = 10,
  min_genes = 5,
  pvalue_cutoff = 0.05,
  qvalue_cutoff = 0.05,
  p_adjust_method = "BH",
  readable = TRUE,
  test_type = "t"
)

if (nrow(go_result$genes) > 0L) {
  p_go_genes <- plot_go_genes(
    go_result = go_result,
    top_n = 5,
    method_col = "method",
    cluster_col = "cluster",
    gene_col = "gene",
    point_size = 3,
    theme_name = "classic"
  )

  p_go_genes$plot
}