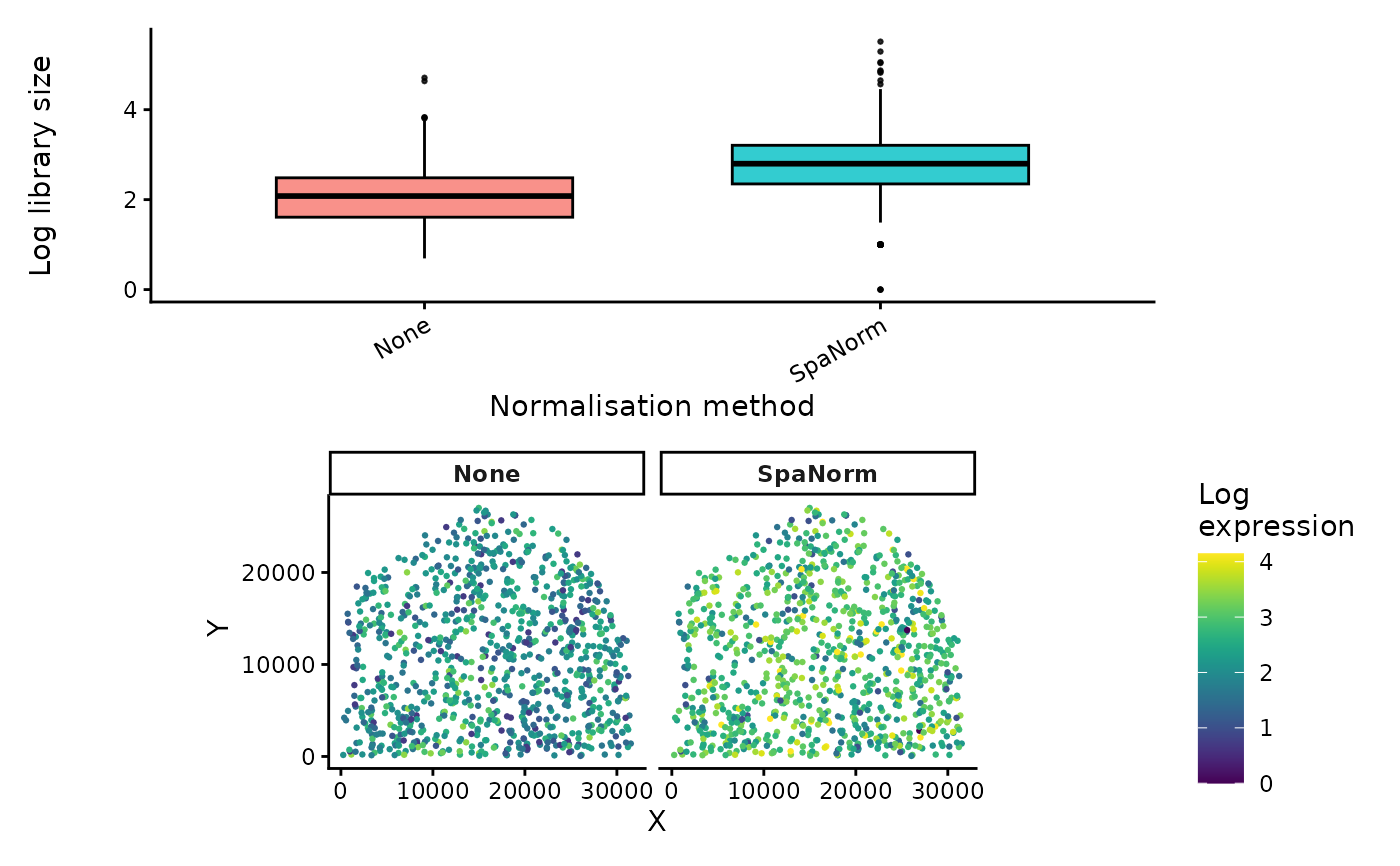
Compare normalised library sizes across methods
Source:R/library_size_runner.R
plot_library_size_comparison.RdCalculate and visualise total normalised expression across spatial locations for different normalisation methods.
Usage
plot_library_size_comparison(
  norm,
  methods = NULL,
  assay_name = "logcounts",
  point_size = 0.5,
  theme_name = "classic"
)Details
Log-normalised expression is back-transformed using expm1(), summed across genes, and transformed again using log1p().
Produces a boxplot and spatial maps.
By default, sctransform and Giotto are excluded because their transformed expression values may not represent log1p-transformed non-negative expression.
Examples
data(norm_example)

p_ls <- plot_library_size_comparison(
  norm_example,
  methods = NULL,
  assay_name = "logcounts",
  point_size = 0.5,
  theme_name = "classic"
)

p_ls$plot