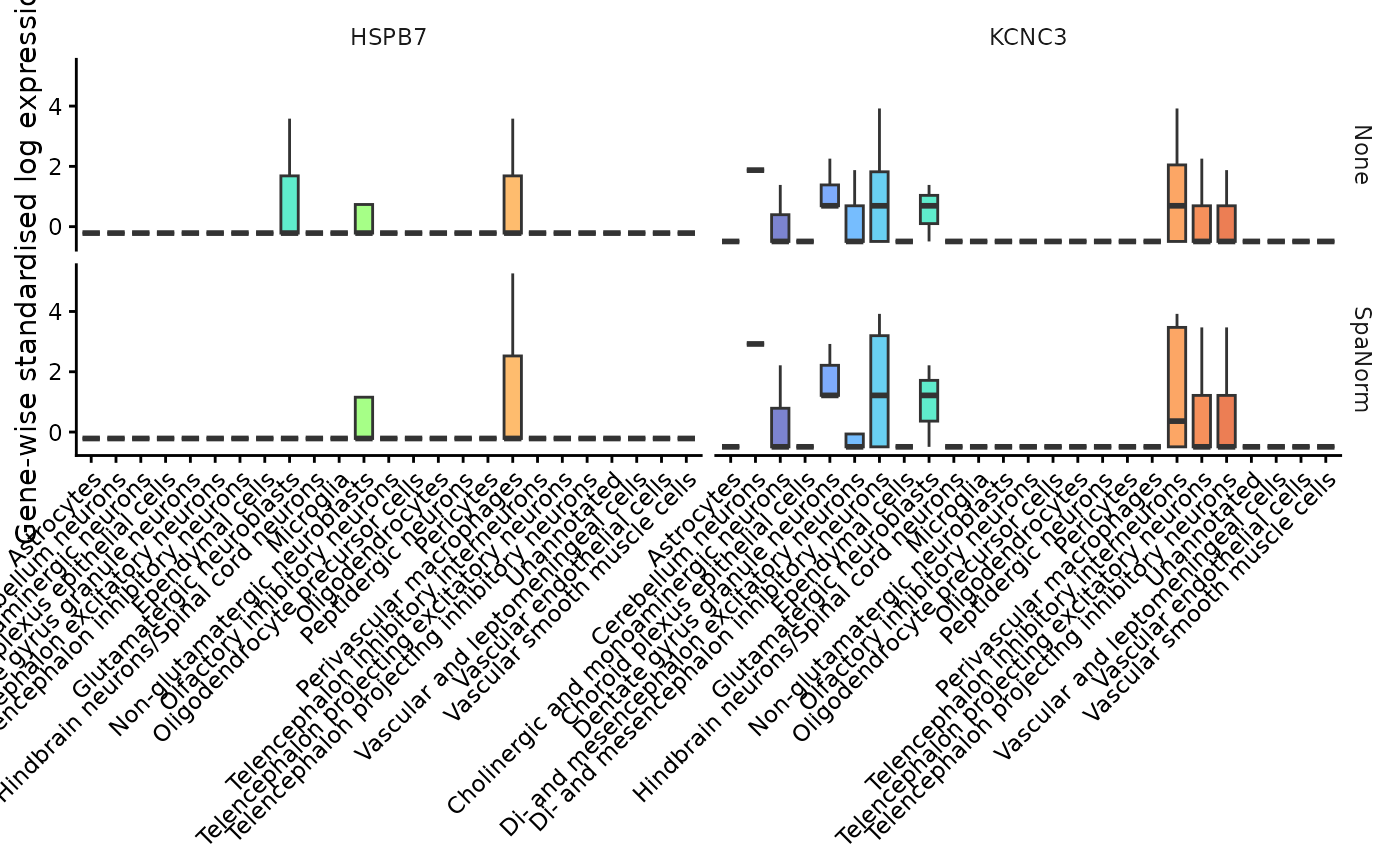
Plot marker expression across normalisation methods
Source:R/cell_type_runner.R
plot_marker_expression.RdCompare marker-gene expression distributions across selected cell types and normalisation methods.
Usage
plot_marker_expression(
  norm_list,
  markers,
  annotation_col = "SingleR_label",
  methods = NULL,
  method_order = NULL,
  cell_types = NULL,
  reference_method = NULL,
  scale_expression = TRUE,
  winsorize = TRUE,
  winsor_quantile = 0.99,
  layout = "method_gene",
  palette = "viridis",
  box_width = 0.7,
  theme_name = "classic"
)
Arguments
- norm_list
Named list of SpatialExperiment objects.
- markers
Character vector of marker genes.
- annotation_col
Cell-type annotation column.
- methods
Optional character vector selecting normalisation methods. NULL includes all methods.
- method_order
Optional character vector specifying the display order of selected methods.
- cell_types
Optional character vector selecting cell types. NULL includes all cell types.
- reference_method
Optional method used to define fixed cell-type annotations across methods.
- scale_expression
If TRUE, apply pooled gene-wise Z-score standardisation across methods and cells.
- winsorize
If TRUE, cap expression at the specified upper quantile before plotting or scaling.
- winsor_quantile
Upper winsorisation quantile.
- layout
Facet layout. Either "method_gene" or "gene_celltype".
- palette
Optional named colour vector or viridis palette name.
- box_width
Width of boxplots.
- theme_name
Plot theme.