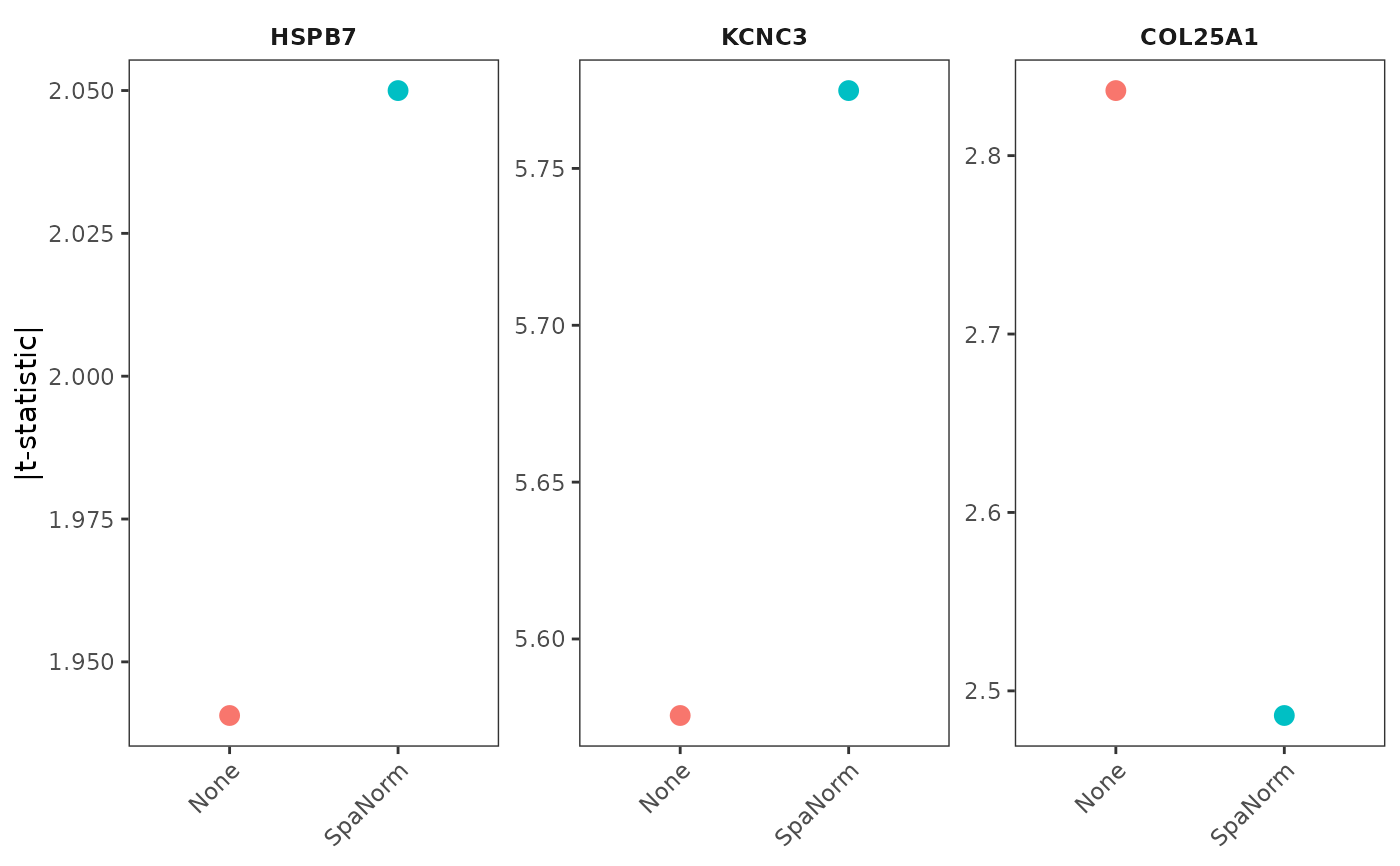
Performs Welch's two-sample t-test for selected marker genes, comparing expression in the specified cell group against all other cells across normalisation methods.
Usage
plot_marker_ttest(
  norm,
  genes,
  marker_labels,
  region_col = "cell_type",
  assay_name = "logcounts",
  method_order = NULL,
  method_colors = NULL,
  point_size = 3,
  scales = "free_y",
  ncol = NULL,
  nrow = NULL,
  theme_name = "classic"
)
Arguments
- norm
Named list of normalised SpatialExperiment objects.
- genes
Character vector of marker genes.
- marker_labels
Expected cell type or region for each gene. Must have the same length as genes.
- region_col
Column name in colData containing cell type or spatial region annotations.
- assay_name
Expression assay. Default is "logcounts".
- method_order
Optional order of normalisation methods.
- method_colors
Optional named vector of method colours.
- point_size
Point size. Default is 3.
- scales
Facet scales: fixed, free, free_x, or free_y.
- ncol
Number of facet columns.
- nrow
Number of facet rows.
- theme_name
Plot theme.
Examples
data(norm_example)

genes <- head(rownames(norm_example[[1]]), 3)

region <- as.character(
  SummarizedExperiment::colData(norm_example[[1]])$cell_type
)

marker_labels <- rep(
  names(sort(table(region), decreasing = TRUE))[1],
  length(genes)
)

p_marker <- plot_marker_ttest(
  norm = norm_example,
  genes = genes,
  marker_labels = marker_labels,
  region_col = "cell_type",
  assay_name = "logcounts",
  scales = "free_y",
  ncol = 3,
  theme_name = "bw"
)

p_marker$plot