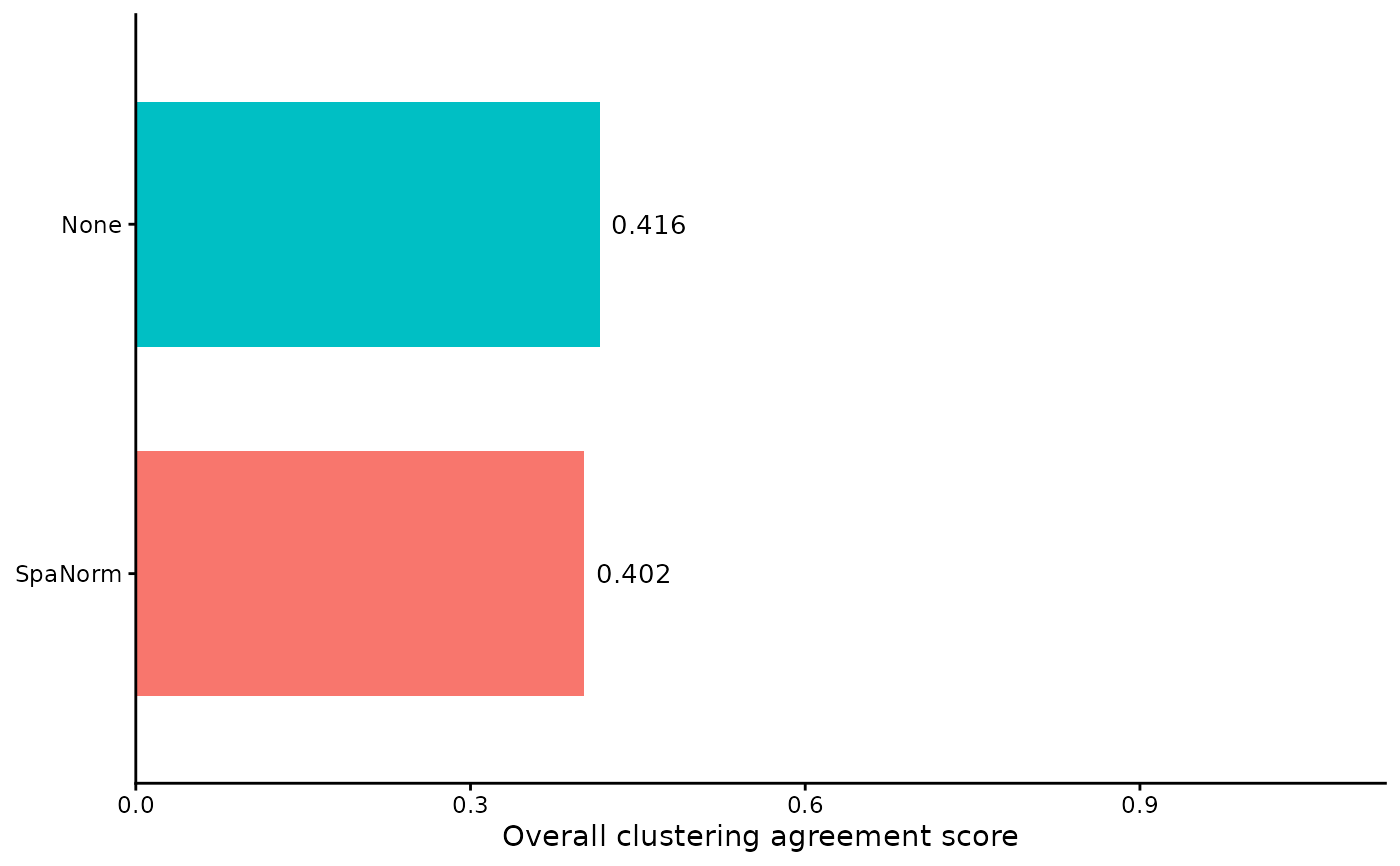
Display overall clustering agreement scores across normalisation methods.
Usage
plot_normalization_ranking(
  ranking_df,
  bar_width = 0.7,
  palette = NULL,
  label_size = 3.5,
  show_values = TRUE,
  theme_name = "classic"
)Examples
data(norm_example)

banksy_norm <- run_banksy_individual(
  norm_list = norm_example,
  seed = 123
)
#> Computing neighbors...
#> Spatial mode is kNN_median
#> Parameters: k_geom=15
#> Done
#> Done
#> Using seed=123
#> Using seed=123
#> Computing neighbors...
#> Spatial mode is kNN_median
#> Parameters: k_geom=15
#> Done
#> Done
#> Using seed=123
#> Using seed=123

metrics_df <- calculate_clustering_metrics(
  norm_list = banksy_norm,
  ground_truth_col = "layer_guess"
)

ranking_df <- rank_normalization_methods(
  metrics_df = metrics_df
)

p <- plot_normalization_ranking(
  ranking_df = ranking_df,
  bar_width = 0.7,
  label_size = 3.5,
  theme_name = "classic"
)

p$plot