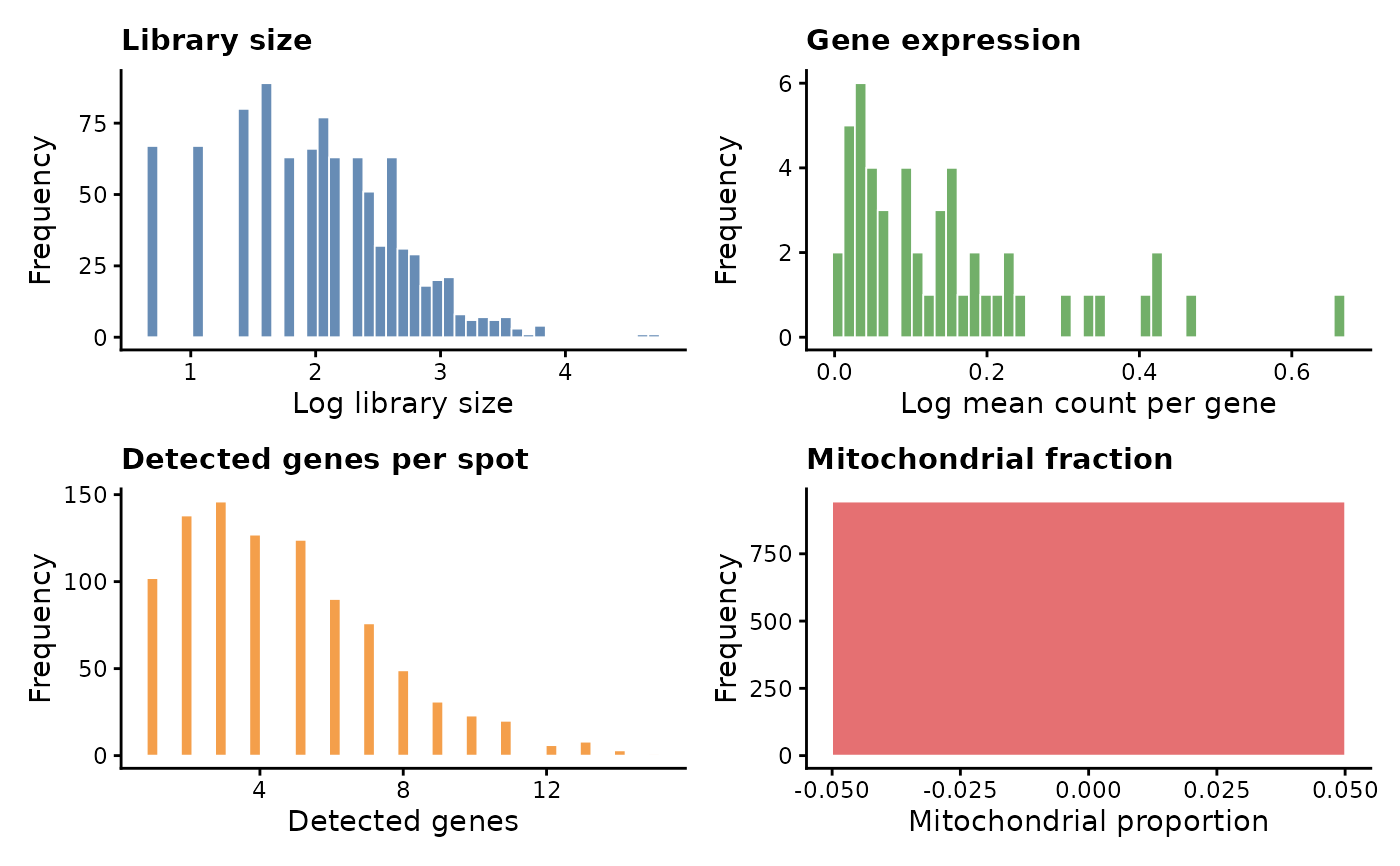
Plot distributions of the main spot-level and gene-level
QC metrics stored in a SpatialExperiment object.
Usage
plot_qc(spe, bins = 45, show_density = TRUE, theme_name = "classic")
Arguments
- spe
A SpatialExperiment object containing QC metrics
generated by `add_qcs()`.
- bins
Number of histogram bins. Default is 45.
- show_density
Logical. If TRUE, density curves are
added to the histograms.
- theme_name
Plot theme. One of `"classic"`, `"bw"`,
`"minimal"`, or `"gray"`.
Value
A list containing plotting data, individual plots,
and the combined plot.
Details
The function can be used before or after filtering.
Examples
data(spe_example)

spe_qc <- add_qcs(
  spe_example,
  assay_name = "counts",
  mito_pattern = "^MT-"
)

p_qc <- plot_qc(
  spe_qc,
  bins = 45,
  show_density = TRUE,
  theme_name = "classic"
)

p_qc$plot