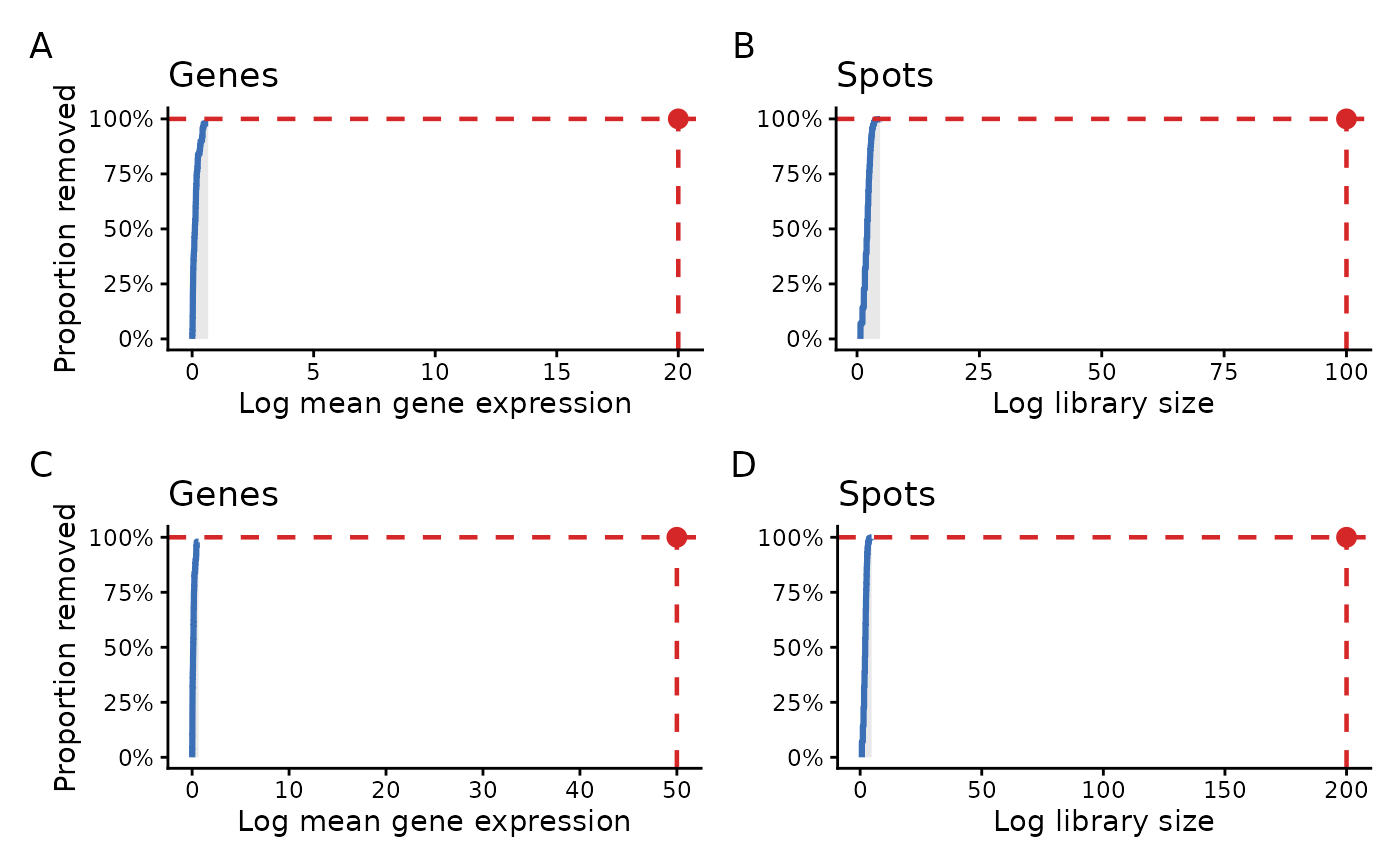
Show how different QC cutoff values affect the proportion of spots and genes that would be removed.
Usage
plot_qc_cutoffs(
  spe,
  library_cutoff = NULL,
  gene_cutoff = NULL,
  n_points = 200,
  theme_name = "classic"
)
Arguments
- spe
A SpatialExperiment object containing QC metrics generated by `add_qcs()`.
- library_cutoff
Optional selected cutoff for log library size.
- gene_cutoff
Optional selected cutoff for log mean gene expression.
- n_points
Number of cutoff values used to construct each curve. Default is 200.
- theme_name
Plot theme. One of `"classic"`, `"bw"`, `"minimal"`, or `"gray"`.
Examples
data(spe_example)

spe_qc <- add_qcs(
  spe_example,
  assay_name = "counts",
  mito_pattern = "^MT-"
)

ls <- c(100, 200)
gc <- c(20, 50)

p <- lapply(seq_len(2), function(i) {
  p_cutoffs <- plot_qc_cutoffs(
    spe_qc,
    library_cutoff = ls[i],
    gene_cutoff = gc[i],
    n_points = 200,
    theme_name = "classic"
  )

  p_cutoffs$plot
})

patchwork::wrap_plots(p, ncol = 1) +
  patchwork::plot_annotation(tag_levels = "A")