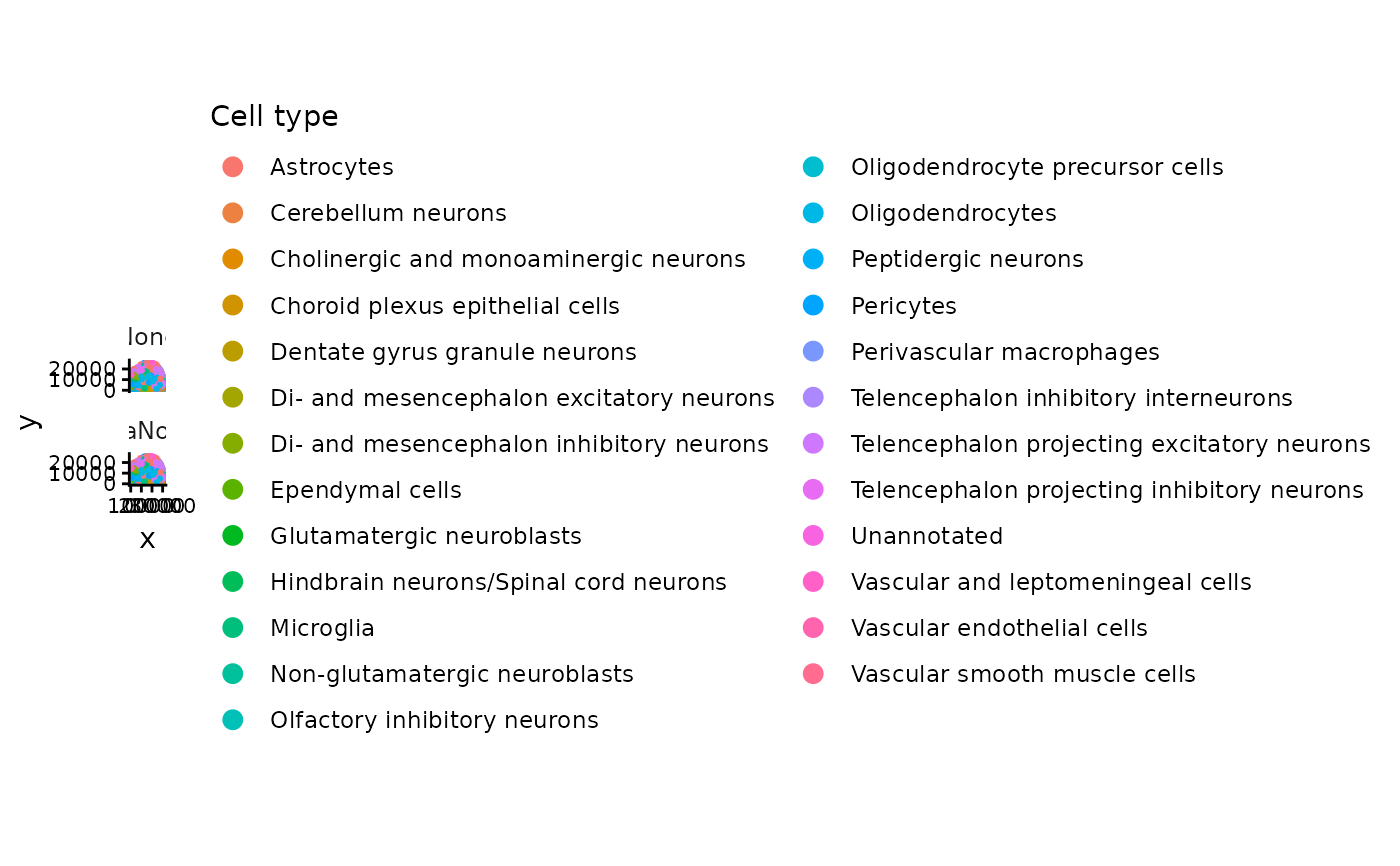
Plot cell-type annotations stored in the colData of SpatialExperiment objects across normalisation methods.
Usage
plot_spatial_annotation(
  norm_list,
  annotation_col = "SingleR_label",
  method_order = NULL,
  point_size = 0.5,
  palette = NULL,
  ncol = 1,
  theme_name = "classic"
)
Arguments
- norm_list
Named list of annotated SpatialExperiment objects.
- annotation_col
Name of the colData column containing cell-type annotations.
- method_order
Optional character vector specifying the order of normalisation methods.
- point_size
Point size for spatial locations.
- palette
Colour palette. One of "viridis", "magma", "inferno", "plasma", "cividis", "rocket", "mako", "turbo", or a custom character vector of colours. If NULL, the default ggplot2 palette is used.
- ncol
Number of facet columns.
- theme_name
Plot theme. One of "classic", "bw", "minimal", or "gray".
Examples
data(norm_example)

p <- plot_spatial_annotation(
  norm_list = norm_example,
  annotation_col = "cell_type",
  point_size = 0.5,
  theme_name = "classic"
)

p$plot