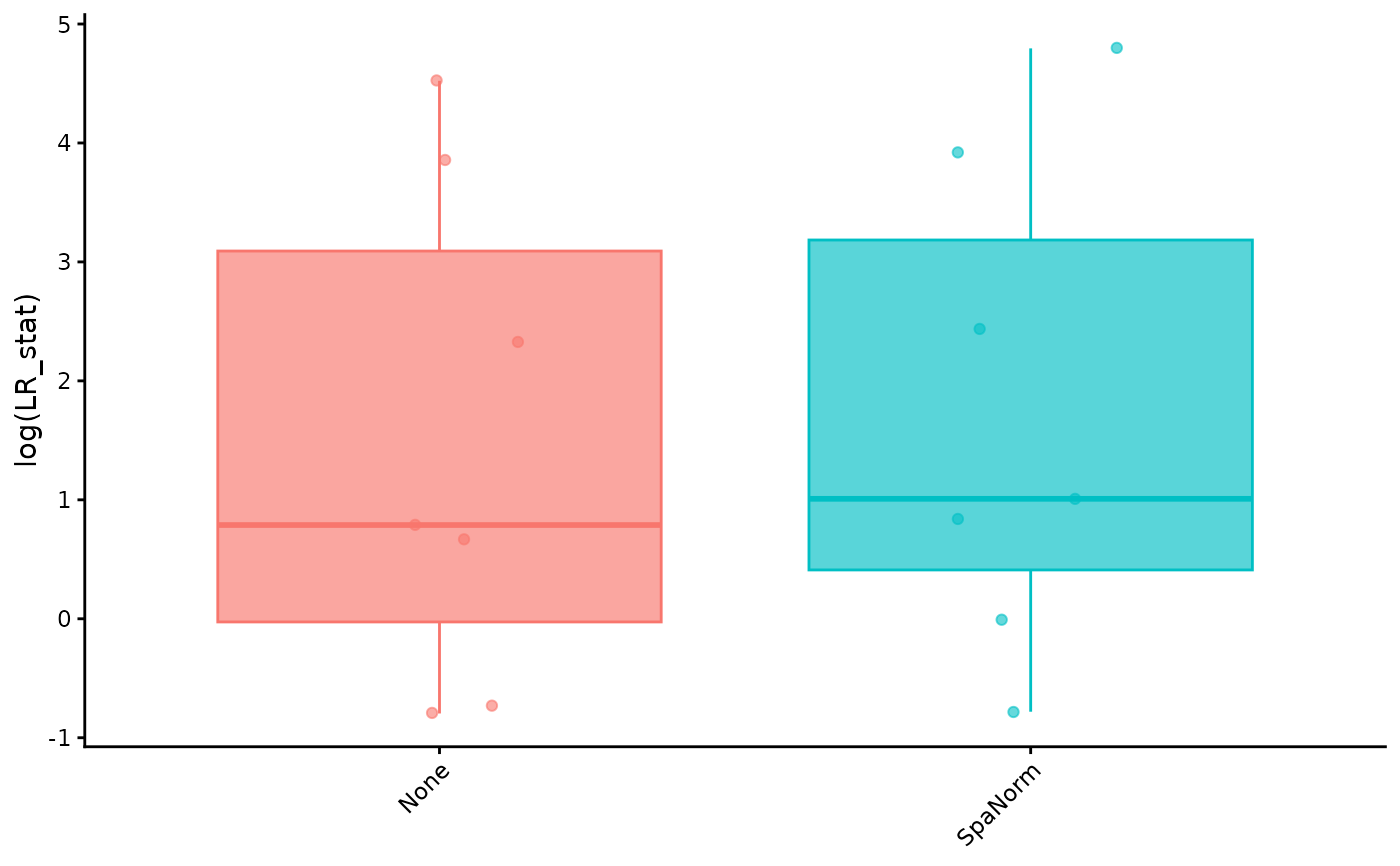
Plot SVG statistic distribution for a gene set
Source:R/svg_gene_set.R
plot_svg_gene_set_distribution.RdPlot SVG statistic distribution for a gene set
Arguments
- svg_norm
Named SVG results.
- genes
Gene set.
- stat
SVG statistic.
- method_order
Optional method order.
- method_colors
Optional named colours.
- gene_id
Gene identifier.
- transform
Transformation.
- plot_type
boxplot or violin.
- add_jitter
Add gene-level points.
- point_size
Point size.
- alpha
Point transparency.
- theme_name
Plot theme.