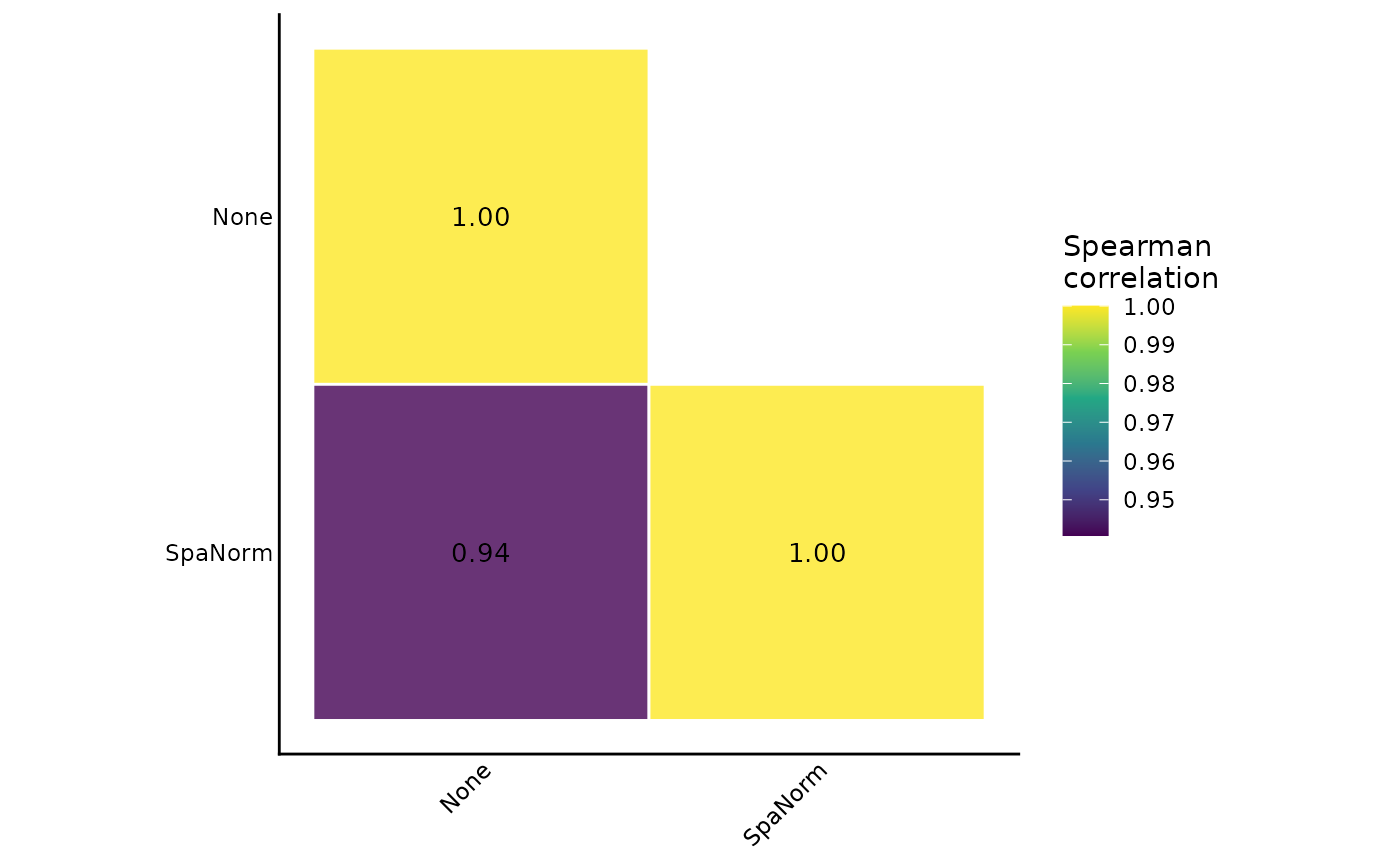
Plot SVG Rank Correlation Across Normalisation Methods
Source:R/svg_marker.R
plot_svg_rank_correlation.RdCalculates pairwise Spearman rank correlations of SVG rankings across normalisation methods.
Usage
plot_svg_rank_correlation(
  svg_norm,
  methods = NULL,
  gene_id = "rownames",
  method_order = NULL,
  method_colors = c("#B2182B", "#F7F7F7", "#2166AC"),
  show_values = TRUE,
  digits = 2,
  theme_name = "classic"
)
Arguments
- svg_norm
Named list of SVG results.
- methods
Optional methods to compare.
- gene_id
Gene identifier. Default is "rownames".
- method_order
Optional order of normalisation methods.
- method_colors
Three colours for low, middle, and high correlations.
- show_values
Display correlation values. Default TRUE.
- digits
Number of decimal places.
- theme_name
Plot theme.
Details
Only genes shared by all selected methods are used. The heatmap displays the lower triangle of the correlation matrix, including the diagonal.
Examples
data(svg_example)

p <- plot_svg_rank_correlation(
  svg_norm = svg_example,
  show_values = TRUE,
  digits = 2
)

p$plot