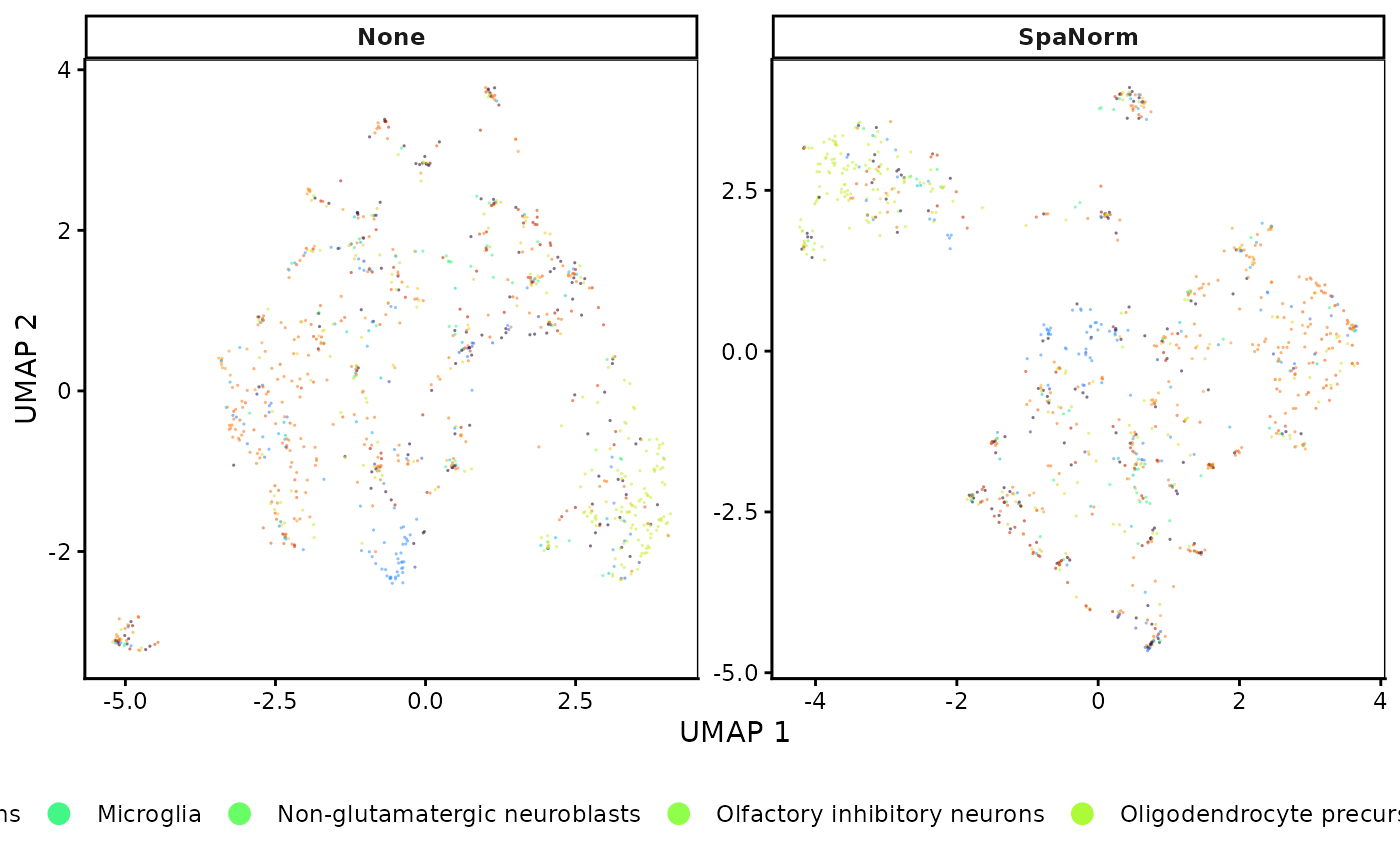
Visualise previously calculated UMAP embeddings using one or multiple colData annotations without recalculating PCA or UMAP.
Usage
plot_umap_comparison(
  umap_data,
  colour_by = "region",
  point_size = 0.58,
  alpha = 0.6,
  ncol = 3,
  theme_name = "classic"
)Details
A single annotation uses facet_wrap by method. Multiple annotations use facet_grid with methods in rows and annotations in columns.
Examples
data(norm_example)

umap_data <- get_umap_data(
  norm_example,
  methods = NULL,
  prop_spots = 1,
  seed = 123,
  assay_name = "logcounts",
  n_pcs = 30,
  n_neighbors = 15
)
#> Running PCA and UMAP: None
#> Warning: You're computing too large a percentage of total singular values, use a standard svd instead.
#> Running PCA and UMAP: SpaNorm
#> Warning: You're computing too large a percentage of total singular values, use a standard svd instead.

p_umap_layer <- plot_umap_comparison(
  umap_data,
  colour_by = "cell_type",
  point_size = 0.58,
  alpha = 0.6,
  ncol = 3,
  theme_name = "classic"
)

p_umap_layer$plot