Visualises the spatial locations of spots retained and removed after quality control filtering. Retained spots are shown in blue, while removed spots are shown in red.
Details
Spots are classified by comparing their column names in the original and filtered SpatialExperiment objects. All spatial coordinates are obtained from the original object.
This function helps identify whether QC filtering removes spots from particular spatial regions.
Examples
data(spe_example)

spe_qc <- add_qcs(
  spe_example,
  assay_name = "counts",
  mito_pattern = "^MT-"
)

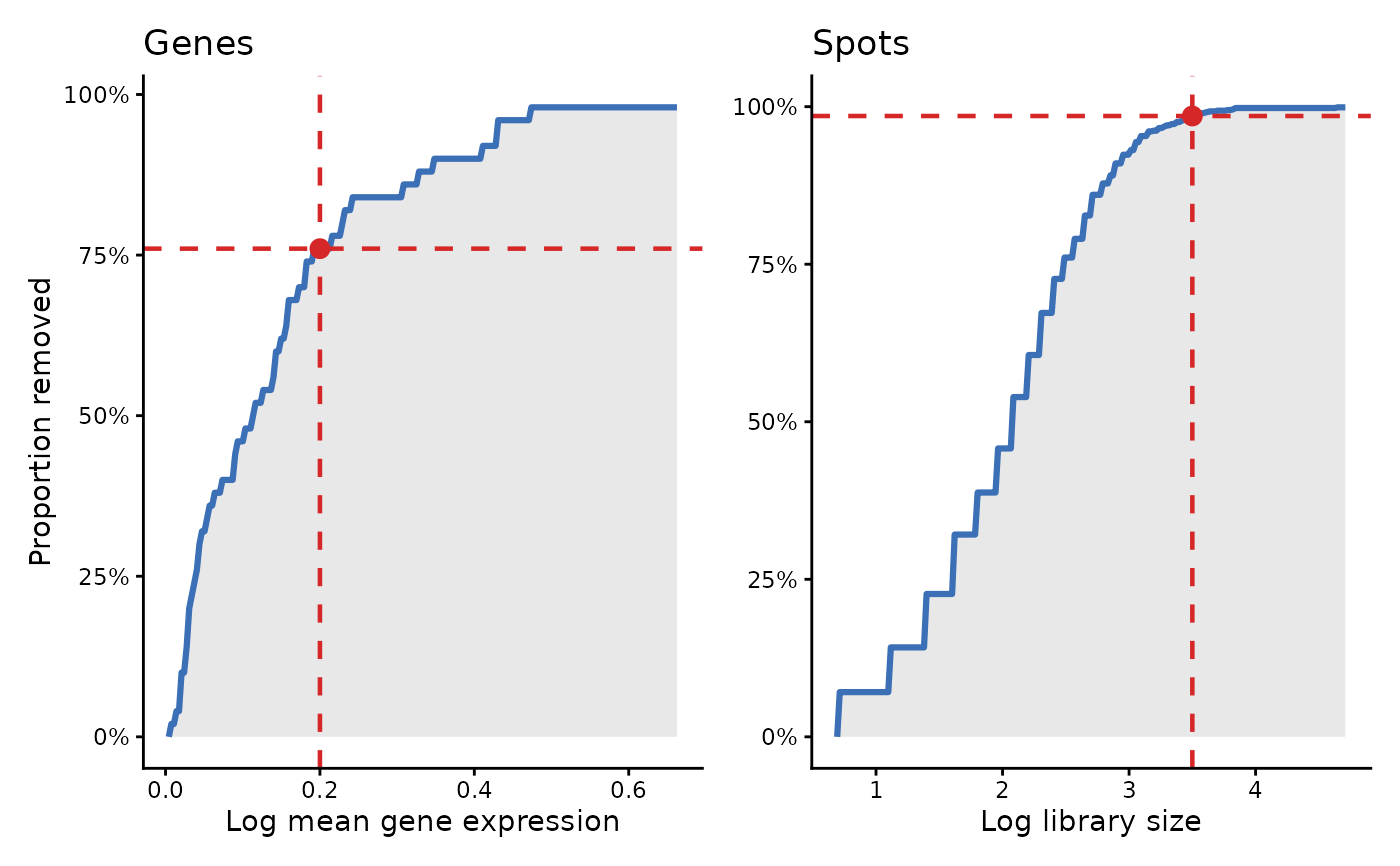
p_cutoffs <- plot_qc_cutoffs(
  spe_qc,
  library_cutoff = 3.5,
  gene_cutoff = 0.2,
  n_points = 200,
  theme_name = "classic"
)

p_cutoffs$plot